Global Carbon Account 2019
I4CE’s 2019 Global Carbon Accounts present the main trends in the implementation of global carbon pricing policies in 2019.
5 key trends in 2019
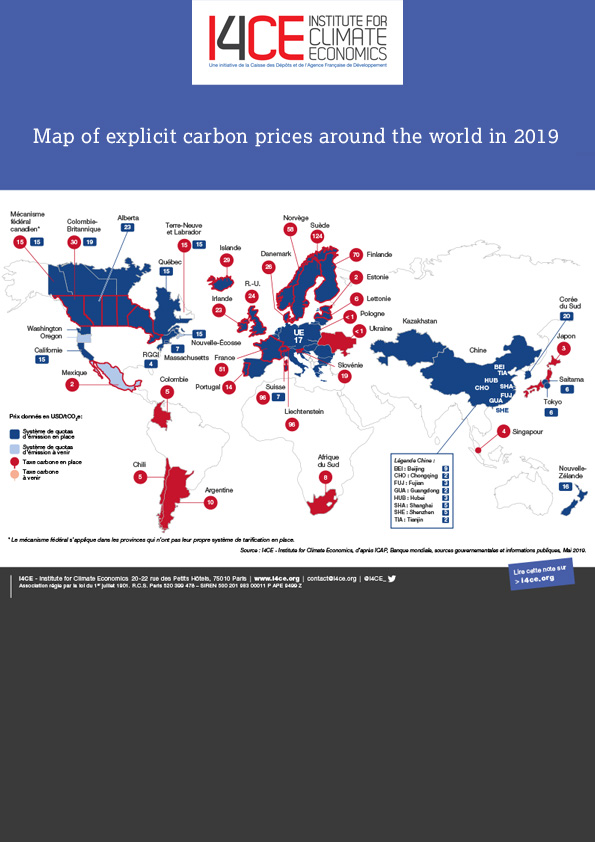
- As of May 1, 2019, 25 carbon taxes and 26 Emissions Trading Schemes (ETS) were operating worldwide. The jurisdictions covered by one or more explicit carbon price account for around 60% of global GDP.
- Carbon prices are making headway globally despite local setbacks. In Canada, provincial elections in Ontario and Alberta led to rolling back provincial pricing schemes; at the same time, the pan-Canadian backstop is being implemented countrywide on all provinces that do not have their own pricing scheme. In France, the yellow vest protests prompted the government to freeze the carbon tax at its current rate of USD 51, yet the tax was not rolled back. The year 2020 shall see Mexico and China ETSs start operations with actual positive prices.
- Carbon pricing mechanisms generated USD 45 billion (EUR 40 billion) in revenues in 2018, up from USD 32 billion in 2017 and USD 22 billion in 2016. This increase is mostly due to a rise in EU ETS prices, from below USD 10 until 2018 to above USD 25 lately.
- In 2018, 52% of carbon pricing revenues came from carbon taxes. Carbon revenues are mostly channeled to the general budget, or earmarked for environmental purposes.
- More than 75% of emissions regulated by carbon pricing are still covered by a price below USD 10 (EUR 8). To stay on the 2°C trajectory while sustaining economic growth, the High-Level Commission on carbon prices led by economists Stern and Stiglitz recommends carbon prices between USD 40 and USD 80 per ton of CO2 by 2020, and between USD 50 and USD 100 per ton of CO2 by 2030.