Global Carbon Account in 2020
Explicit carbon pricing systems – a tax or a carbon market – continue to develop around the world. In the 2020 edition of its Global Carbon Accounts, I4CE presents the main trends and provides an overview of these public policies: the countries that have adopted them, the sectors covered, the price levels, the revenues generated and what is being done with them. Find all this information in graphics.
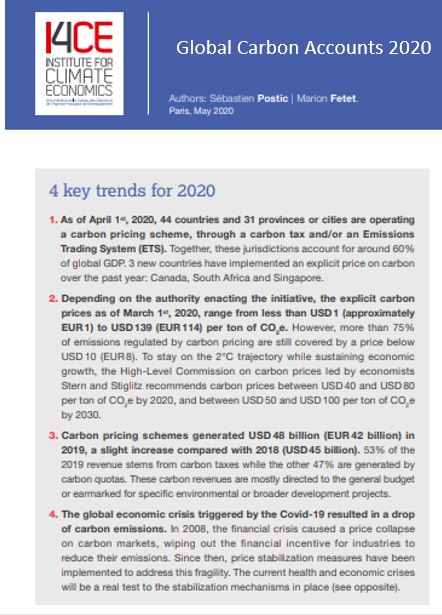
4 key trends for 2020
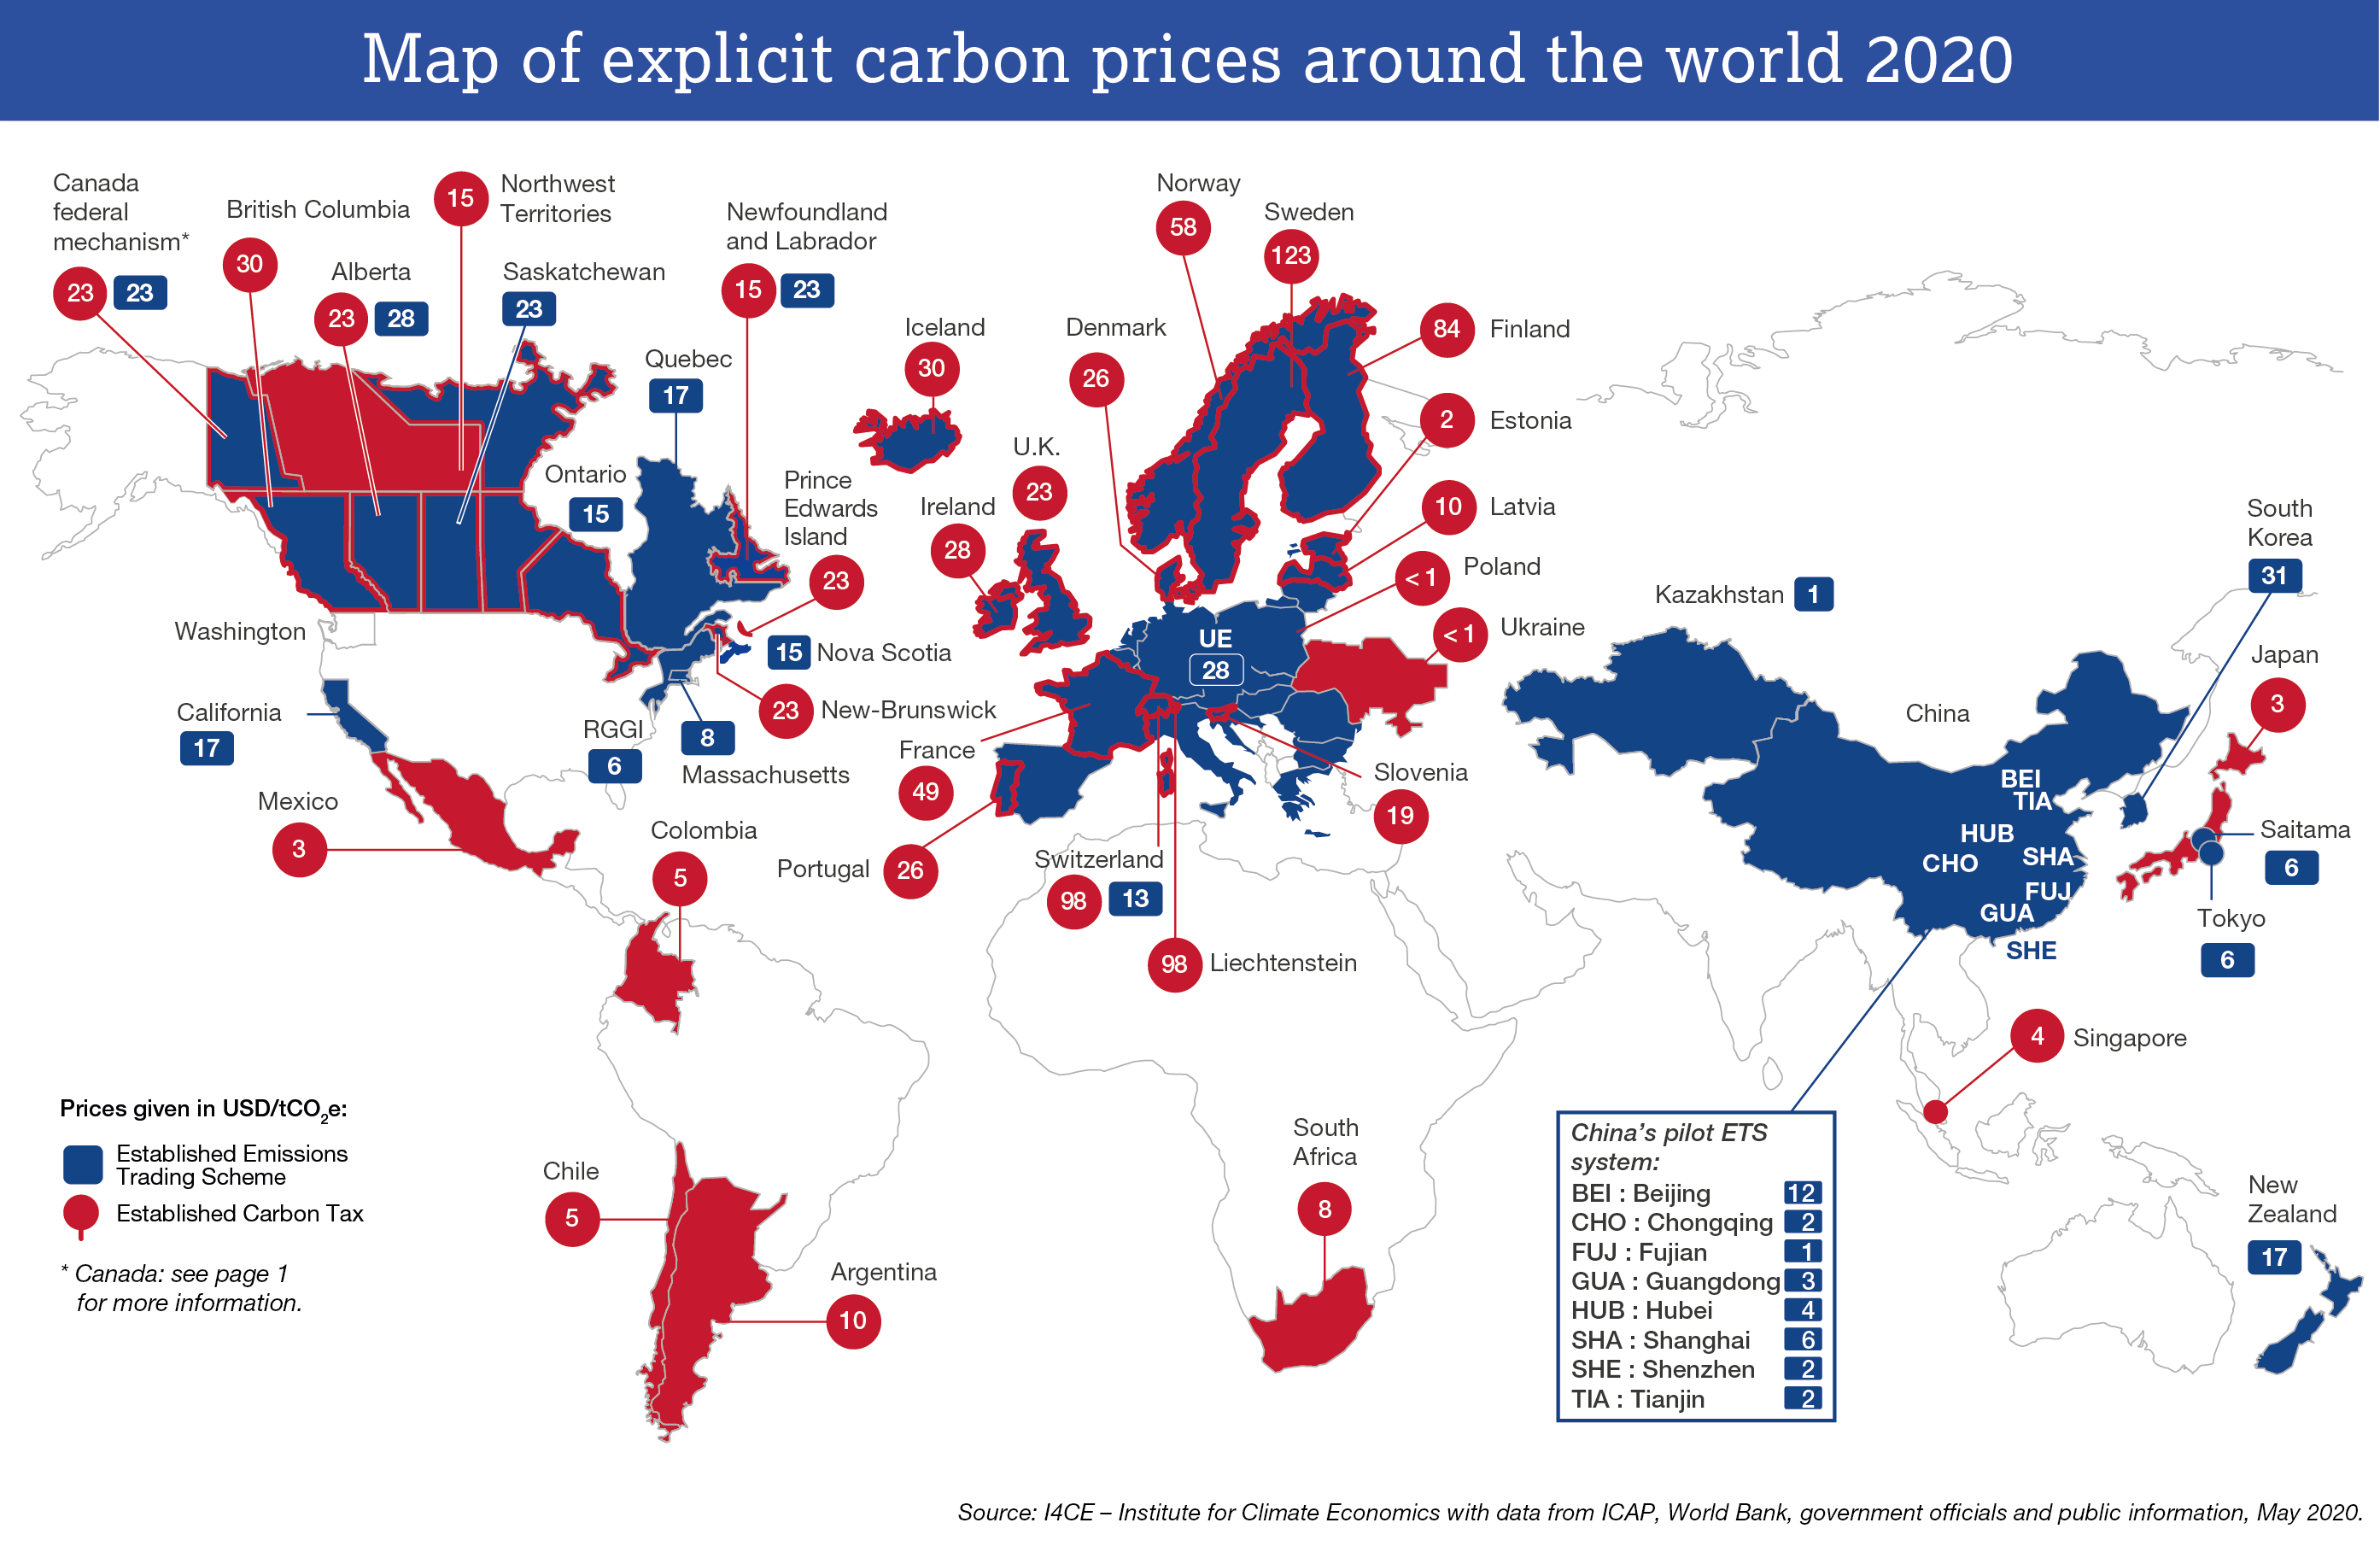
- As of April 1st, 2020, 44 countries and 31 provinces or cities are operating a carbon pricing scheme, through a carbon tax and/or an Emissions Trading System (ETS). Together, these jurisdictions account for around 60% of global GDP. 3 new countries have implemented an explicit price on carbon over the past year: Canada, South Africa and Singapore.
- Depending on the authority enacting the initiative, the explicit carbon prices as of March 1st, 2020, range from less than USD 1 (approximately EUR 1) to USD 123 (EUR 114) per ton of CO2e, However, more than 75% of emissions regulated by carbon pricing are still covered by a price below USD 10 (EUR 8). To stay on the 2°C trajectory while sustaining economic growth, the High-Level Commission on carbon prices led by economists Stern and Stiglitz recommends carbon prices between USD 40 and USD 80 per ton of CO2e by 2020, and between USD 50 and USD 100 per ton of CO2e by 2030.
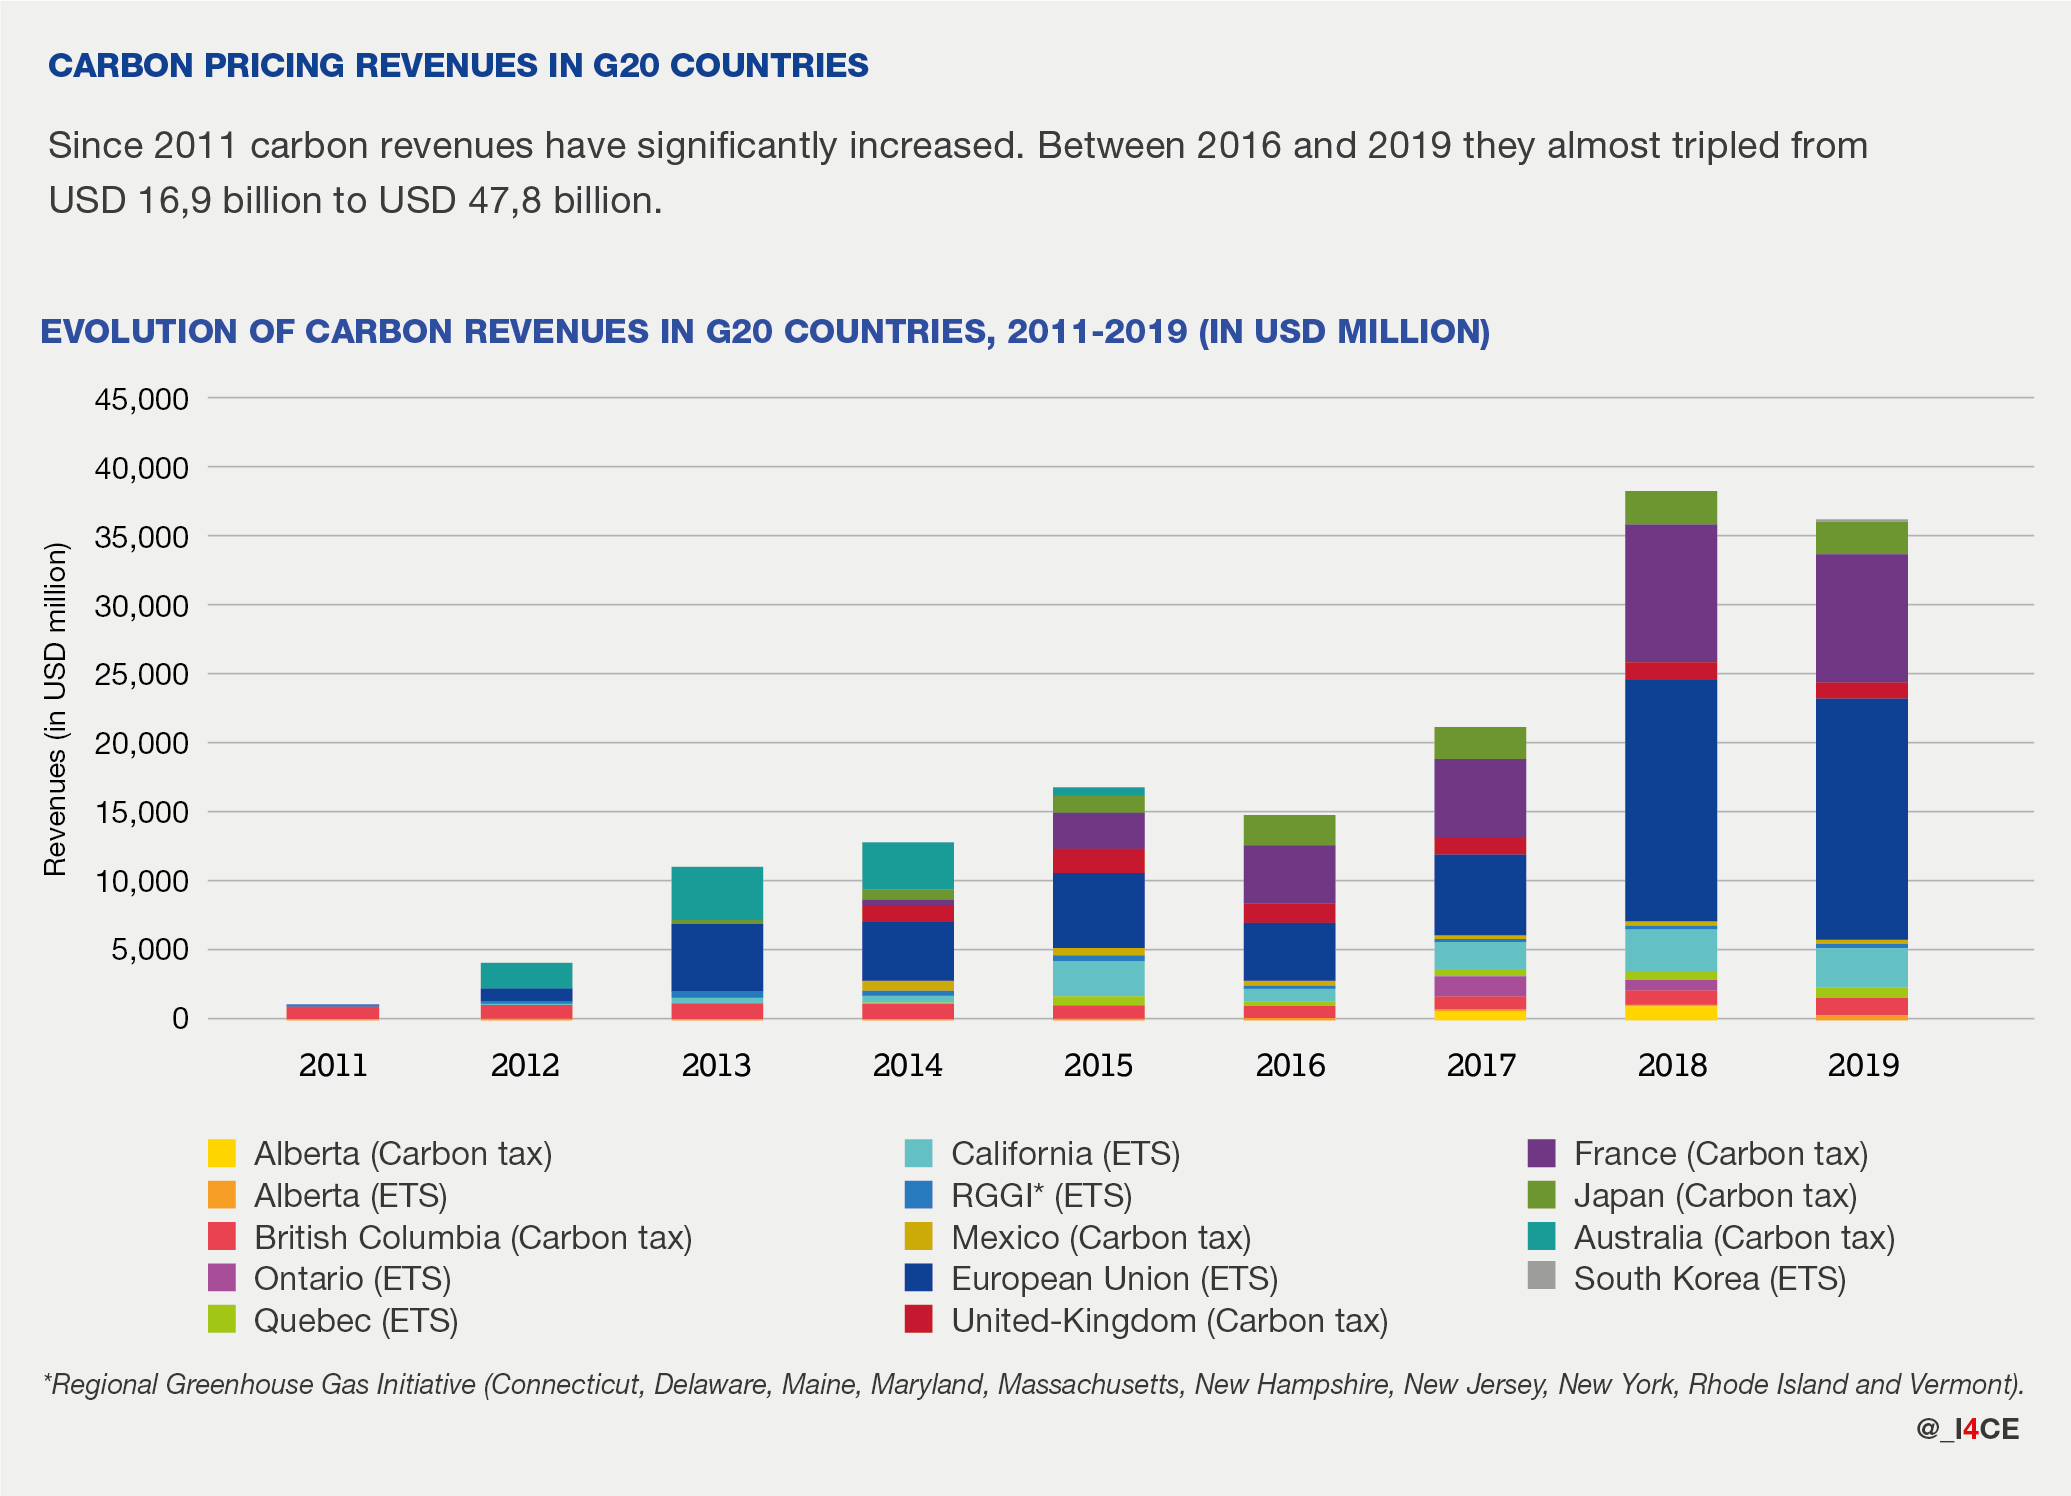
- Carbon pricing schemes generated USD 48 billion (EUR 42 billion) in 2019, a slight increase compared with 2018 (USD 45 billion). 53% of the 2019 revenue stems from carbon taxes while the other 47% are generated by carbon quotas. These carbon revenues are mostly directed to the general budget or earmarked for specific environmental or broader development projects.
- The global economic crisis triggered by the Covid-19 resulted in a drop of carbon emissions. In 2008, the financial crisis caused a price collapse on carbon markets, wiping out the financial incentive for industries to reduce their emissions. Since then, price stabilization measures have been implemented to address this fragility. The current health and economic crises will be a real test to the stabilization mechanisms in place (see opposite).
I4CE
See the carbon pricing revenues in G20 countries
Principal sources and useful links:
- I4CE Global Carbon revenue map in 2019
- “Using carbon revenues”, 2019, World Bank-AFD-I4CE, https://openknowledge.worldbank.org/handle/10986/32247
- “State and Trends of Carbon Pricing 2019”, World Bank, https://openknowledge.worldbank.org/handle/10986/13334
- Carbon pricing dashboard, World Bank,https://carbonpricingdashboard.worldbank.org/
- ICAP Status report 2020, https://icapcarbonaction.com/en/icap-status-report-2020
- ETS Map, ICAP, https://icapcarbonaction.com/en/ets-map
- Effective Carbon Rates 2018: Pricing Carbon Emissions Through Taxes and Emissions Trading, OECD, https://doi.org/10.1787/9789264305304-en
- The use of revenues from carbon pricing, working paper OCDE, 2019 https://doi.org/10.1787/3cb265e4-en.
- PINE Database, OECD, https://pinedatabase.oecd.org/

