Global carbon accounts 2025
Carbon pricing instruments and the unlocked potential of carbon revenues
Carbon pricing key figures
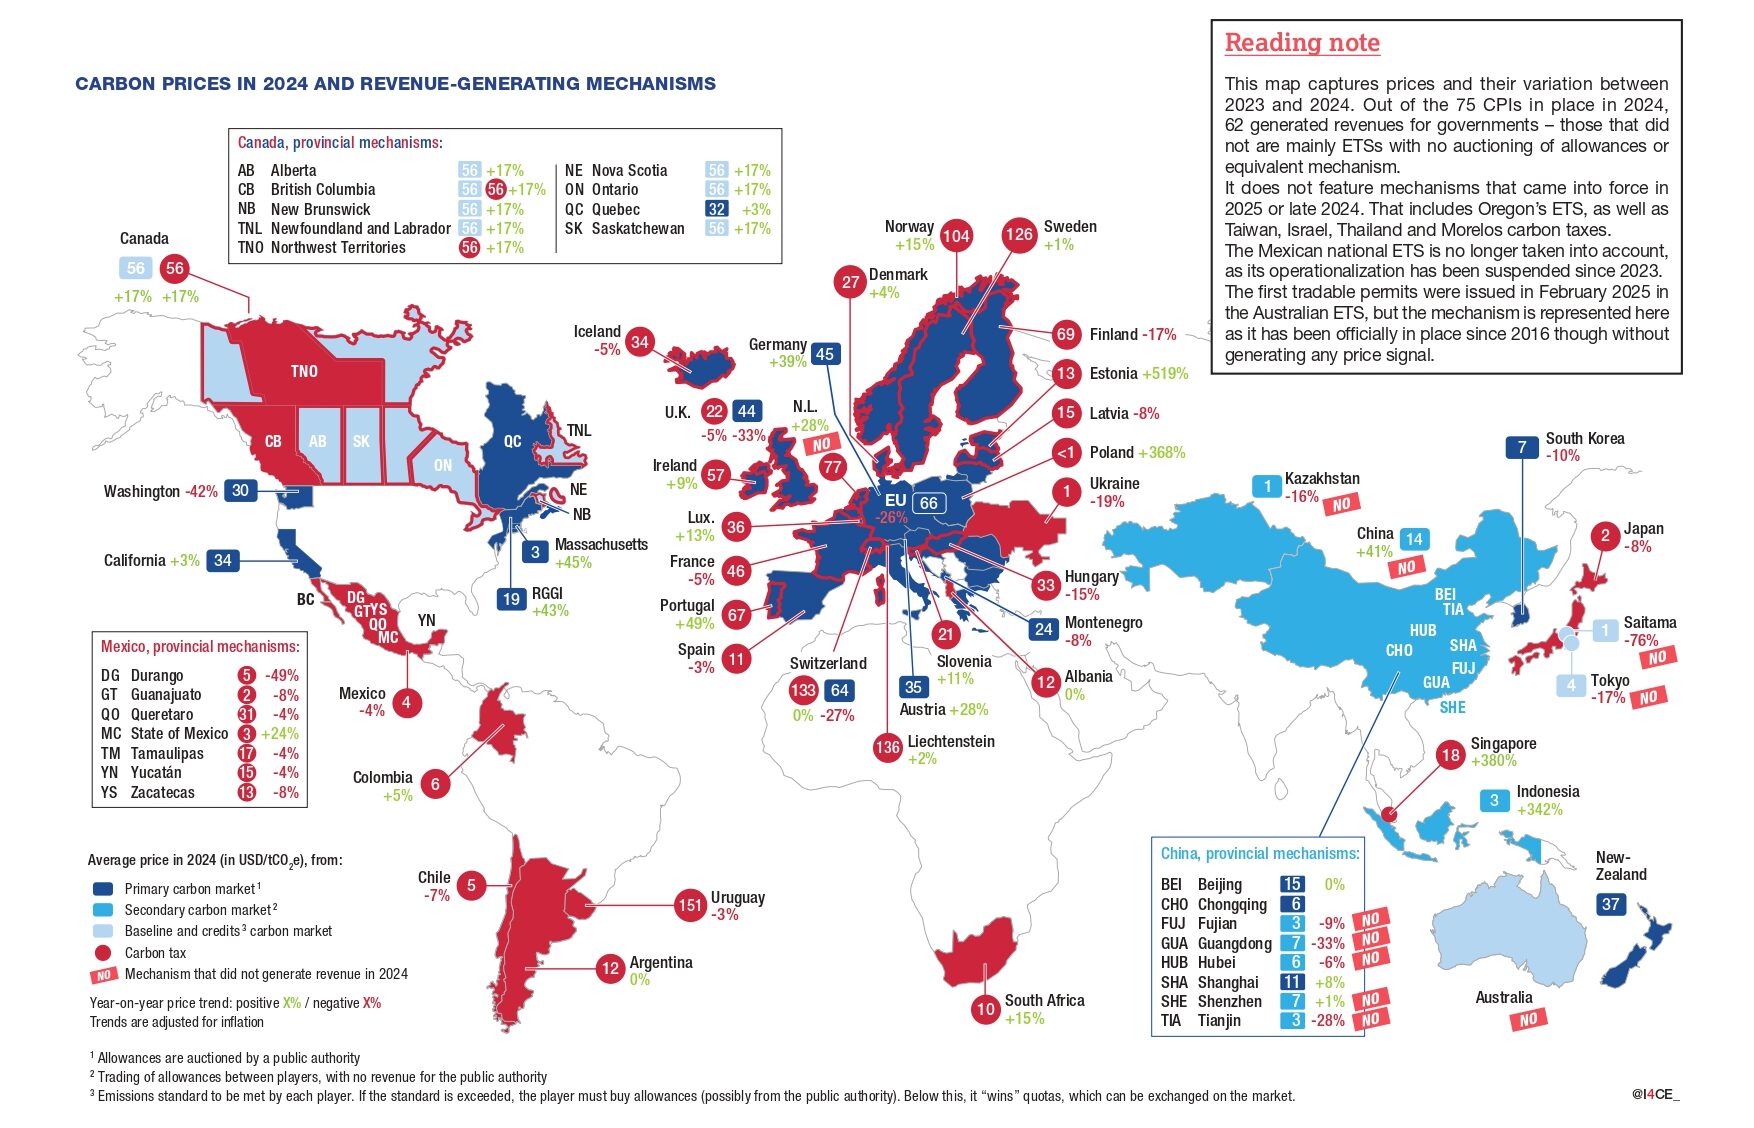
78 carbon pricing instruments (CPIs) put a price on carbon emissions worldwide as of May 1, 2025, with 43 carbon taxes and 35 emissions trading systems (ETS). Out of these 44 operate at the national level, 33 at the subnational level (including regional initiatives such as RGGI and WCI), and only the EU ETS at the supranational level. 74 of these 78 systems were already in place in 2024. This same year, jurisdictions with carbon pricing instruments (CPIs) accounted for 65% of global GDP.
USD 0.1-160 is the range of explicit carbon prices, which widened again in 2024. While the price reached USD 160 per ton of CO2 equivalent emissions (tCO2 e) in Uruguay, it remained below USD 10 cents/ tCO2 e for Poland’s carbon tax (although Poland is also part of the EU-ETS). Only 20% of covered emissions are priced in line with the Stern-Stiglitz Commission’s recommendations, which in 2017 estimated that full incentive effects require prices between USD 40-80/tCO2 e by 2020, and USD 50- 100/tCO2 e by 2030. Around 74% of covered emissions are priced below USD 20/tCO2 e.
28% of global emissions were covered by a carbon pricing instrument in 2024 – 4 percentage points higher than in the previous edition of the Global Carbon Accounts. This evolution is explained by the expansion of the Chinese national ETS to the cement, steel and aluminum sectors in March 2025, covering 2024 emissions retrospectively. The positive trend is expected to continue in the coming years, with 14 new mechanisms under implementation and more under consideration. In contrast, the share of global emissions covered at an effective price (excluding exemptions and reductions of taxes, as well as free allowances) has remained at 6% since 2023. Jurisdictions where CPIs are already in place account for 52% of global GHG emissions – highlighting the significant potential for expanding emissions coverage within these systems.
Carbon revenues can further contribute to domestic resource mobilization efforts and help fill the finance gap
This 2025 edition of the Global Carbon Accounts presents a landscape of carbon pricing instruments worldwide through the lens of their current and potential contribution to scale up climate and development finance, as key discussions at the international level on the matter are taking place this year – notably in the context of the climate negotiations on the ’Baku to Belem Roadmap to 1.3T’ 1 and the Fourth Finance for Development Conference (FFD4). Several jurisdictions are already using carbon revenues to support a range of policy objectives, including decarbonisation efforts and support for economic actors most affected by the transition. Yet there is still potential for them to further contribute to fill the gap.
USD 103 billion were generated by carbon pricing instruments in place in 2024 (67% by ETSs and 33% by carbon taxes), showing a slight decrease from the record high of nearly USD 106 billion raised in 2023. The decrease is largely due to the drop in emission allowance prices in the European Union Emissions Trading System (EU ETS). Currently, carbon revenues remain relatively concentrated among a few major mechanisms: the EU ETS alone accounts for 41% of total revenues, followed by the German national ETS (14%), and the Canadian carbon tax (9%). Ten jurisdictions together account for 86% of global carbon revenues.
The figure above represents only a fraction of the estimated needs, but there still significant potential to unlock. According to top-down estimates of the Independent High-Level Expert Group on Climate Finance, USD 6.3-6.7 trillion are needed each year for global climate investments by 2030. Emerging and developing economies alone (excluding China) would require USD 2.3-2.5 trillion – comprising USD 1.1 trillion in domestic effort and USD 1.3 trillion in international support.2 Carbon pricing instruments could generate approximately USD 2.6 trillion if all 2024 emissions are priced at USD 50/tCO2.
56% of carbon revenues were earmarked for activities contributing to climate change mitigation and adaptation, environmental protection, or development. One quarter of total revenues is redistributed either directly – through transfers to households or businesses (19%) – or indirectly – via tax exemptions or reductions (6%) – to economically impacted actors (households or firms). The remaining portion (19%) was transferred to government budgets without specific earmarking.
USD 75 billion in additional revenues could have been generated on top of the USD 53,5 billion raised in 2024 by cap-and-trade ETSs alone without free allocation of emission allowances, showing the unlocked potential of carbon revenues. This estimate excludes China and Kazakhstan due to insufficient data to assess their foregone revenues. Nevertheless, China’s national ETS represents the largest untapped source, which now covers 15% of global emissions following its 2025 expansion to include the steel, cement, and aluminum sectors, but 100% of its allowances are allocated for free. This notion of potential government revenue that is not collected due to specific policy choices is referred to as ’revenue foregone’ and can also apply to taxes that have exemptions or reductions in place..


